ECG Interpretation: A Comprehensive Guide
Electrocardiography (ECG) is a key tool in the diagnosis and assessment of heart diseases. This test records the electrical activity of the heart, providing important information about heart rhythm, size and position of the heart, and the presence of any functional disorders. In this article, we will explore how to interpret an ECG and key points to consider.
- Structure of the ECG
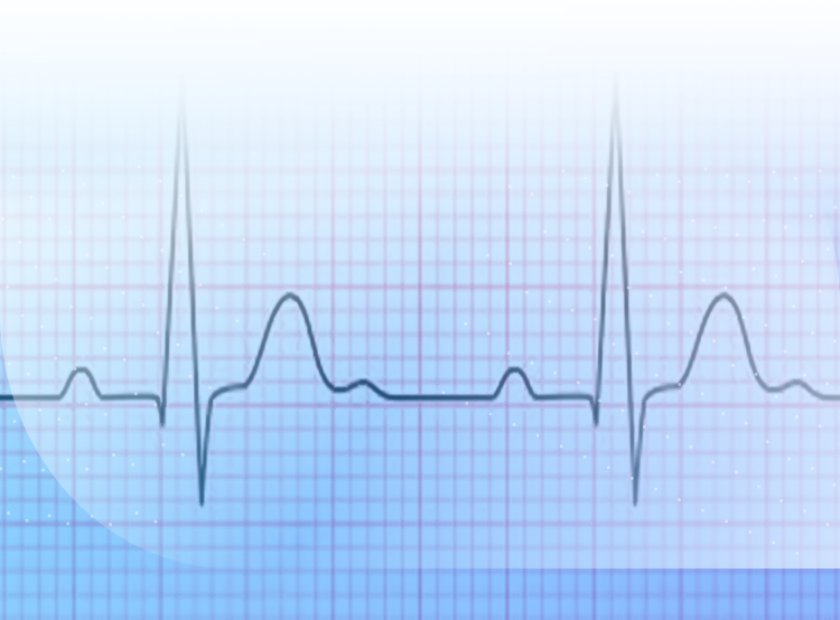
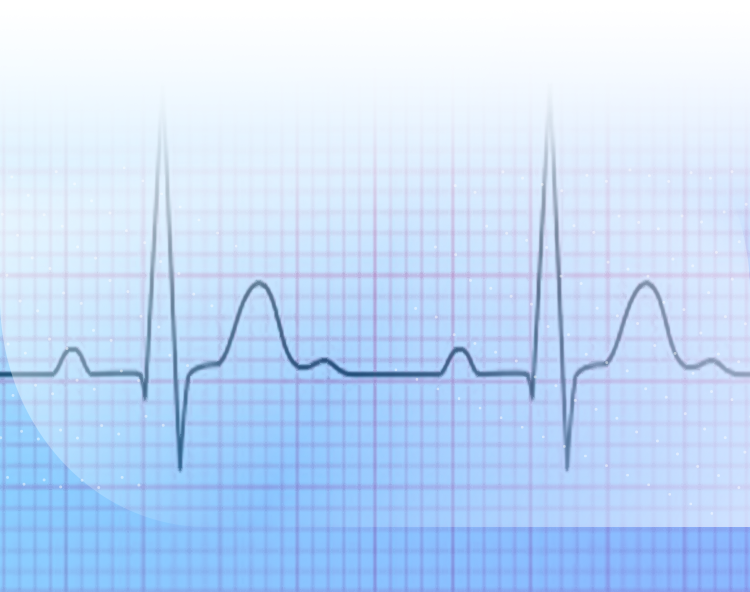
The ECG is recorded as a curve on paper or a display and includes several waves and intervals:
- P Wave: Represents atrial contraction (sinoatrial).
- QRS Complex: Represents ventricular contraction.
- T Wave: Represents the return of the ventricles to a resting state.
- PR Interval: The time between the start of atrial contraction and the start of ventricular contraction.
- QT Interval: The time of ventricular contraction and the return to a resting state.
- Steps in ECG Interpretation
Interpreting an ECG involves several key steps:
a) Assessing Heart Rhythm
- Regular or Irregular: Determine whether the heart rate is regular or irregular. A normal heart rhythm typically ranges from 60 to 100 beats per minute.
- Source of Rhythm: Identify whether the rhythm originates from the sinoatrial (SA) node. The presence of a P wave before each QRS indicates a sinus rhythm.
b) Measuring Heart Rate
- Heart Rate: Calculate the number of beats in one minute. To calculate, count the number of QRS complexes in a 10-second period and multiply by 6.
c) Analyzing Waves
- P Wave: Check if a P wave exists before each QRS and whether its shape is normal.
- QRS Complex: Measure the duration of the QRS (it should be less than 0.12 seconds) and assess its shape.
- T Wave: Examine the shape and height of the T wave. Changes in the T wave may indicate issues such as cardiac ischemia.
d) Measuring Intervals
- PR Interval: Should be between 0.12 and 0.20 seconds. An increase in this interval may indicate AV block.
- QT Interval: Should be less than 0.44 seconds. Prolongation of this interval can increase the risk of arrhythmias.
- Identifying Disorders
ECG interpretation can help identify various disorders:
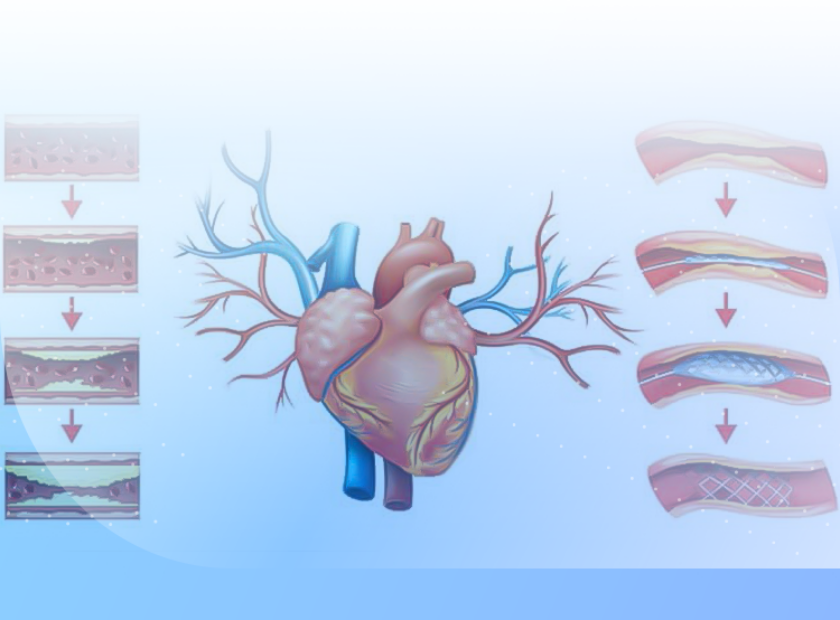
- Coronary Artery Disease: May manifest with changes in the T wave or ST segment.
- Congenital Heart Diseases: Can be identified by changes in the shape and size of waves and intervals.
- Arrhythmias: Such as atrial fibrillation or ventricular tachycardias, which are characterized by changes in heart rhythm.
- Electrolyte Disorders: Changes in waves and intervals may indicate electrolyte imbalances such as hypokalemia or hyperkalemia.
- Conclusion
ECG interpretation is a key skill in medicine that requires training and practice. By mastering the steps of interpretation and recognizing various disorders, physicians can aid in the accurate diagnosis and effective treatment of heart diseases.